01 · The curve
The relationship between heat and work capacity
We didn't invent this curve. The ILO and ISO established, tested, and published it. We simply applied it to the actual temperatures of Nouakchott.
What the science says
When ambient temperature exceeds a certain threshold, the human body must devote increasing energy to cooling itself. That energy is subtracted directly from work capacity. This isn't a theory — it's the result of decades of occupational physiology research, codified in ISO 7243:2017 and documented in the ILO's Working on a Warmer Planet report (2019).
The curve works like this: below 26°C WBGT (wet bulb globe temperature), a worker at moderate intensity retains 100% capacity. Beyond that, each additional degree causes measurable loss. At 33°C WBGT, residual capacity is around 50%. At 36°C, it approaches zero for sustained physical work.
Why moderate intensity?
We use the moderate intensity level (200–300W metabolic rate) because it matches the typical work found in Nouakchott's markets, construction sites, and shops. Not desk work (light intensity), not pure physical labour (heavy). It's someone carrying goods, standing all day, working under a tin awning.
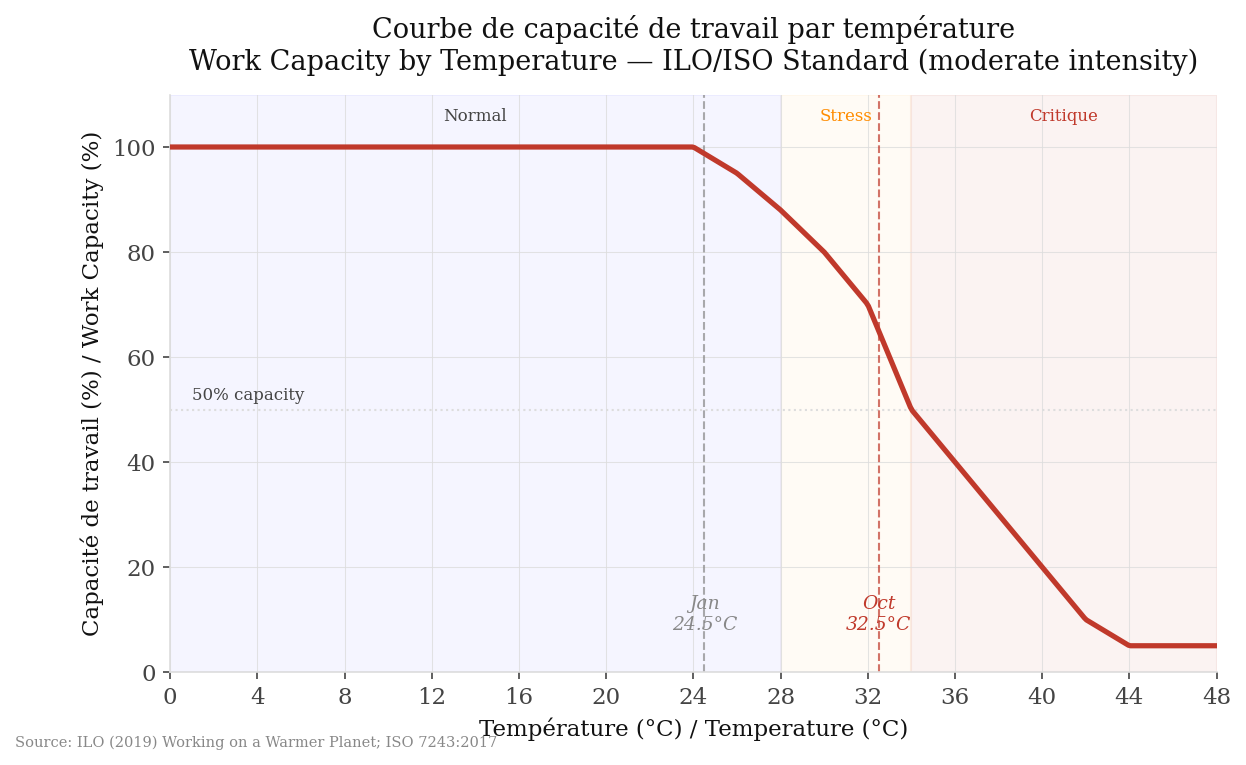
ILO/ISO 7243 curve at moderate intensity. Vertical lines mark Nouakchott's average temperatures in January (best month) and October (worst month).
What this means for Nouakchott
We took hourly data from Open-Meteo for Nouakchott's coordinates (18.0858°N, −15.9785°W) over the period 2019–2025. For each working hour (08:00–18:00), we converted temperature to WBGT and applied the ILO/ISO curve to get a capacity factor between 0 and 1.
The aggregate result: in a typical year, Nouakchott retains about 80% of its theoretical work capacity. The remaining 20% is absorbed by heat. This isn't a failing of the workers — it's a physical constraint imposed by the climate.
Month by month
The compression isn't uniform. January loses 9% — the city runs almost at full capacity. But by April, losses exceed 15%, and they don't drop back until December. The peak is October: 37.8% of capacity lost. That's more than a third of work potential disappearing for an entire month.
| Month | Compression | Residual capacity |
|---|---|---|
| January | 9.0% | 91.0% |
| February | 9.5% | 90.5% |
| March | 12.8% | 87.2% |
| April | 15.6% | 84.4% |
| May | 19.2% | 80.8% |
| June | 24.1% | 75.9% |
| July | 26.3% | 73.7% |
| August | 28.5% | 71.5% |
| September | 34.2% | 65.8% |
| October | 37.8% | 62.2% |
| November | 20.7% | 79.3% |
| December | 11.3% | 88.7% |
None of this will surprise anyone in Nouakchott. September and October are when the city grinds to a lower gear — everyone knows that. What this analysis adds is a number: exactly how much, and exactly what it costs.
The curve isn't a model. It's a thermometer applied to work — if the temperature is X, capacity is Y. No free parameters.